Benchmarks: Overview
As part of the development of the diffing algorithm for VirtualDOM, I ran some benchmarks and prepared different variations of the same algorithm. Before we go over the results, the algorithms, and ideas on how to improve their performance, let's review how the benchmarks work.
You may find the up to date benchmarks on this page: benchmarks.
How were the benchmarks run?
The benchmarks were run with the js-framework-benchmark tool. This tool records the performance of various frameworks using a selenium browser. The browser executes the required commands, the tool calculates if the benchmark ran successfully and then calculate the memory weight or duration of the test.
Usually, these benchmarks are executed using the 40+ frameworks available in the tool, but for the purposes of this experiment and time, I only ran five benchmarks. Three of those benchmarks are the three variations on the diffing algorithm for the framework and the two other are the base cases. The first base case is the framework executions using vanilla JavaScript functions. This execution is intended to give an idea of the default performance from the browser, without any framework. You would usually experiment this kind of performance when executing the exact JavaScript functions on the DOM to crete the results you are looking for.
Most frameworks, however, use more complex system to give the ability to the developer to program possible variations without having to plan for any of them. In the case of React, vue, VirtualDOM, or many other frameworks, we use the virtual DOM pattern to process mutations on the DOM based on what a component creates.
This leads us to the second base case. To be able to compare this framework with official frameworks, I ran the same benchmarks with React without keys. Since our framework doesn't use keys, not assigning any keys when creating elements in a loop in React will give us similar performance to what we'd expect with our framework.
How to read the benchmarks
The benchmarks are divided into three tables. Each table can be sorted by clicking on one of the links of the left side of the table. The head of the table will name each execution, letting you know which framework the numbers of that column are for.
Duration table
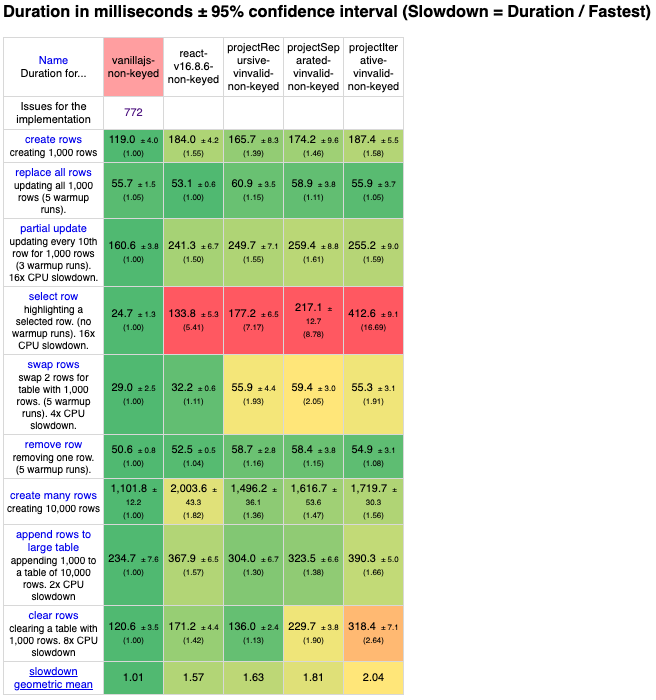
The duration table shows the time take to execute specific operations. For each of the operations, the benchmarking tool executes specific commands on the page 10 times. After having ran the 10 operations, it takes the mean time of execution for each of these 10 runs in milliseconds and that's the information added in the table. For all the recorded times, the smaller the number the better. The rows are then colored in order from green to red to show which framework fares better over the others.
- create rows: Duration for creating 1,000 rows after the page loaded (no warmup).
- replace all rows: Duration for replacing all 1,000 rows of the table (with 5 warmup iterations).
- partial update: Time to update the text of every 10th row for a table with 10,000 rows (with 5 warmup iterations).
- select row: Duration to highlight a row in response to a click on the row. (with 5 warmup iterations).
- swap rows: Time to swap 2 rows on a table with 1,000 rows. (with 5 warmup iterations).
- remove row: Duration to remove a row for a table with 1,000 rows. (with 5 warmup iterations).
- create many rows: Duration to create 10,000 rows (no warmup).
- append rows to large table: Duration for adding 1,000 rows on a table of 10,000 rows (no warmup).
- clear rows: Duration to clear the table filled with 10,000 rows. (no warmup).
Startup table
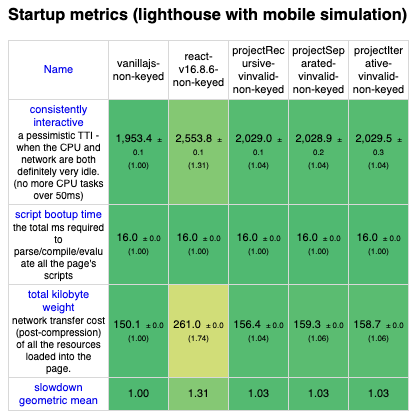
The startup table shows information on the time to interactive for the library. The weight and JavaScript complexity of a framework impact those metrics. The larger a framework is, the longer it takes for that script to be loaded on the network and parser by the browser. The benchmarks use lighthouse to calculate those metrics.
- consistently interactive: The lighthouse metric TimeToConsistentlyInteractive: A pessimistic TTI - when the CPU and network are both definitely very idle. (no more CPU tasks over 50ms).
- script bootup time: The lighthouse metric ScriptBootUpTtime: The total ms required to parse/compile/evaluate all the page's scripts.
- main thread work cost: The lighthouse metric MainThreadWorkCost: Total amount of time spent doing work on the main thread. includes style/layout/etc.
- total byte weight: The lighthouse metric TotalByteWeight: Network transfer cost (post-compression) of all the resources loaded into the page.
Memory table
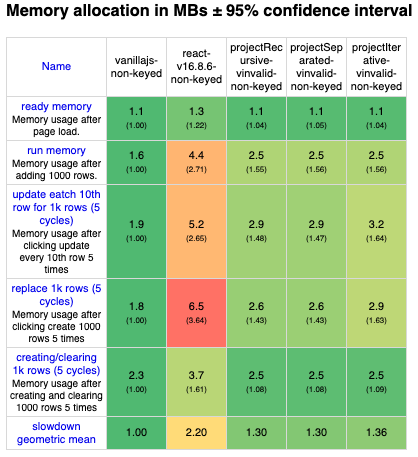
The memory table shows the memory usage for the library. Library using more memory can slow down slower systems and may show memory problems in the system (Like uncleaned nodes that still have some dangling reference). The virtual DOM uses a good amount of memory by design - since the whole idea of the virtual DOM is to keep a copy of the DOM tree in memory - and so it is important to make sure frameworks do not consume an unreasonable amount of memory and slow down mobile devices or slow systems.
- ready memory: Memory usage after page load.
- run memory: Memory usage after adding 1,000 rows.
- update memory: Memory usage after clicking 5 times update for a table with 1,000 rows.
- replace memory: Memory usage after clicking 5 times create 1,000 rows.
- repeated clear memory: Memory usage after creating and clearing 1,000 rows for 5 times.
- update memory: Memory usage after clicking 5 times update for a table with 1,000 rows.
- startup time: Duration for loading and parsing the javascript code and rendering the page.